Creators
Research into a carousel people swipe to the end.
LinkedIn and Instagram carousels
For people who explain thingsStudents, creators, teachers and teams
You put the work in. Infograph makes sure people actually take it in: your articles, AI answers, notes and meetings become beautiful scrolling visual stories in under a minute, with every number checked against your source. No designer. No design skills.
Free every month: 5 Instant infographs and 1 with pictures · No credit card needed to start
The problem
20%
of the words on a web page get read, on average. The rest is scrolled past.Nielsen Norman Group, “How little do users read?”
It isn't your ideas. It's the wall of text they're stuck inside.

The shift
How it works
Real screens from the Infograph app.
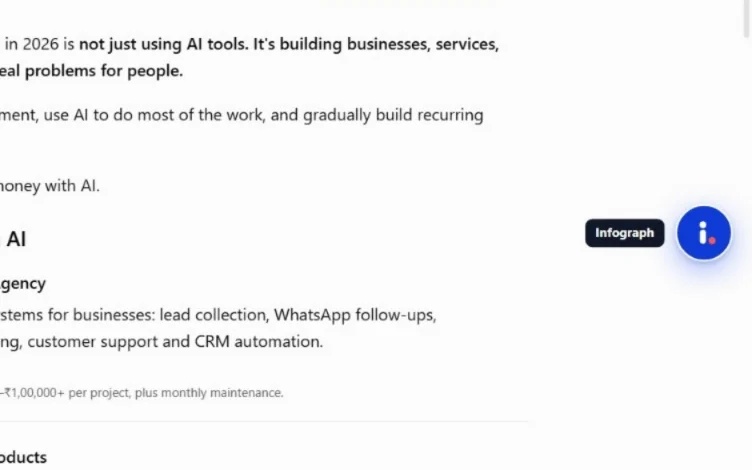
Paste it, or tap the Infograph button on any web page or AI chat.
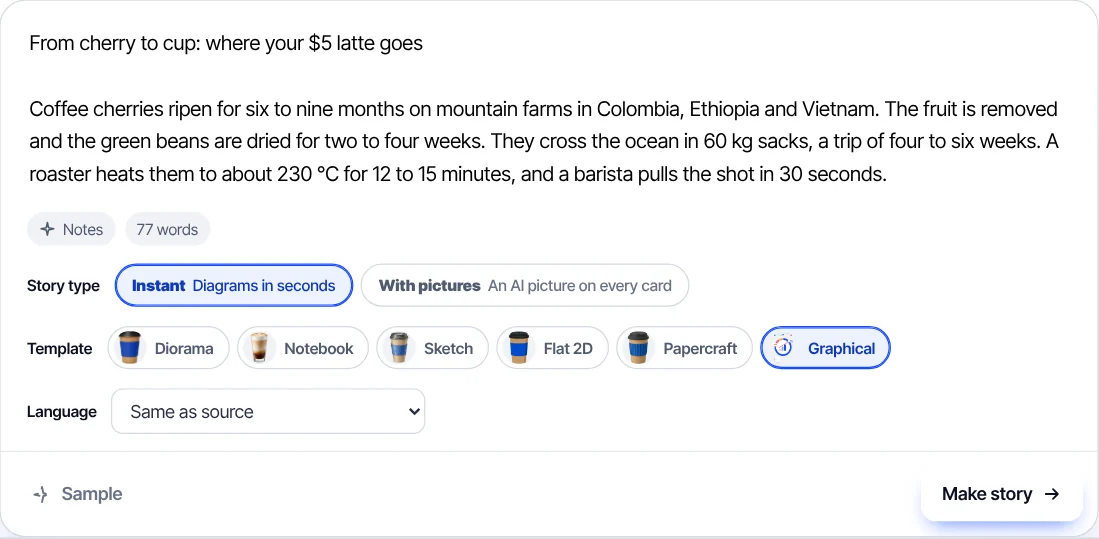
Instant draws diagrams in seconds; With pictures adds an AI picture to every card. Eight art-directed templates and 26 languages.
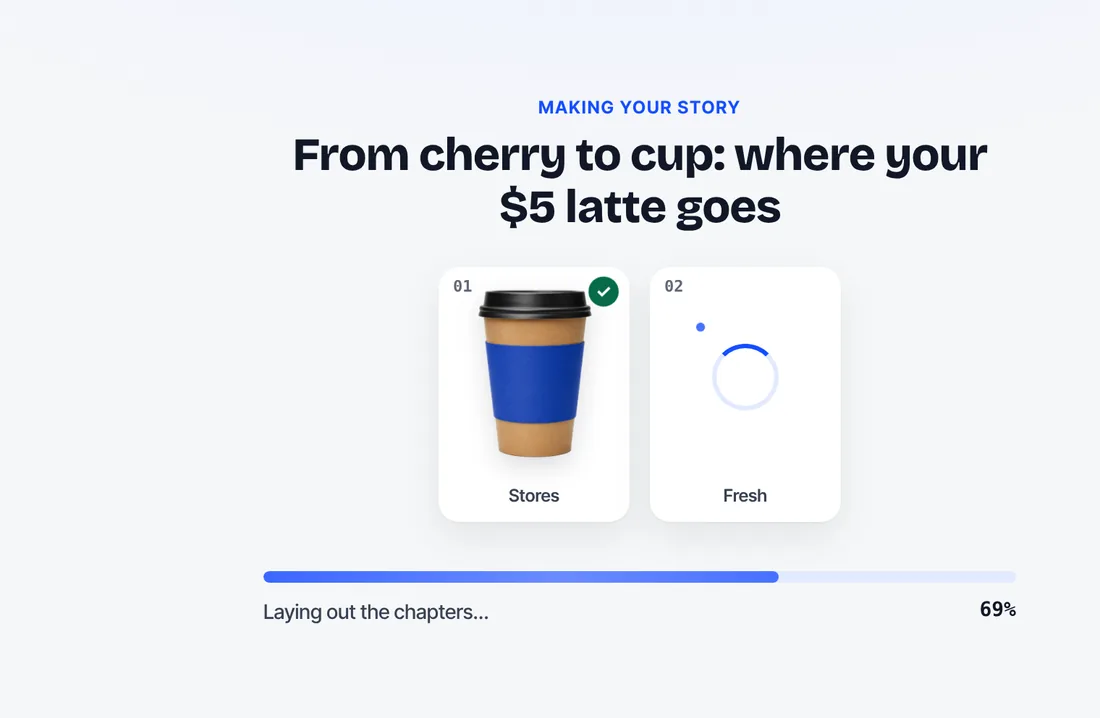
About 15 seconds later for Instant, under a minute with pictures, and every number checked against your text.
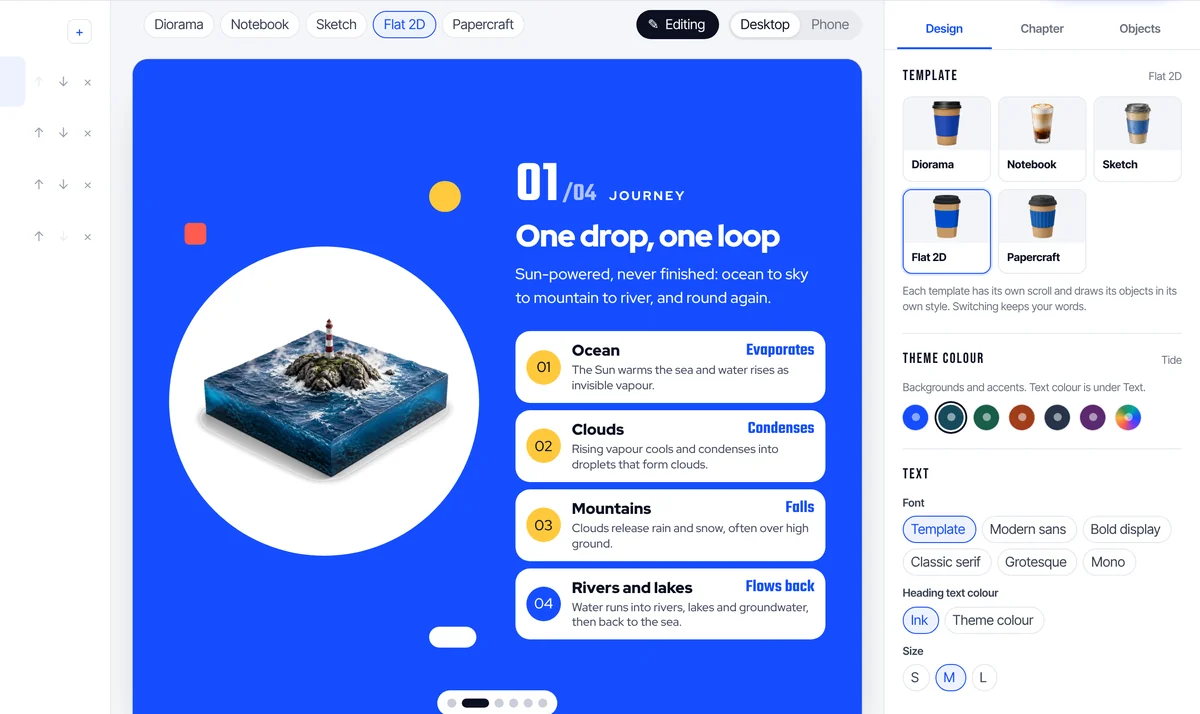
Switch template, colours or fonts, edit any word, or ask for a change in plain words.
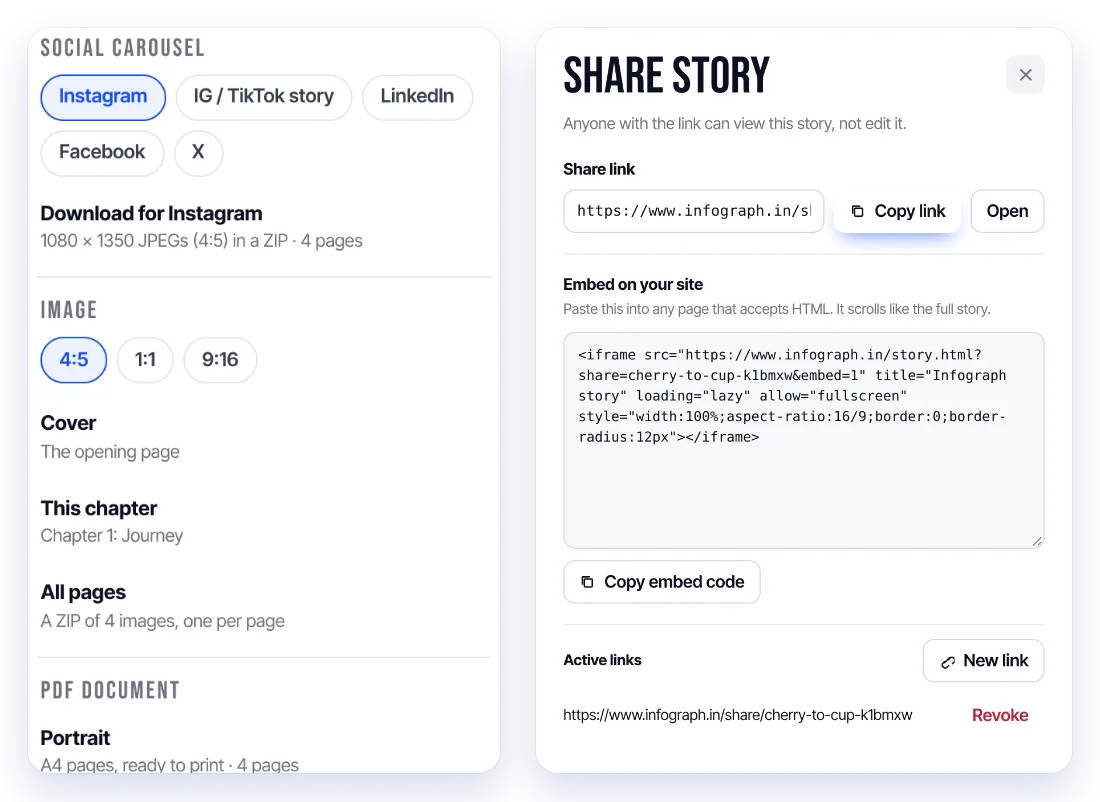
Carousels, images, an A4 or slide PDF, a video with voice-over, or a link and embed you can revoke any time.
A real Infograph story
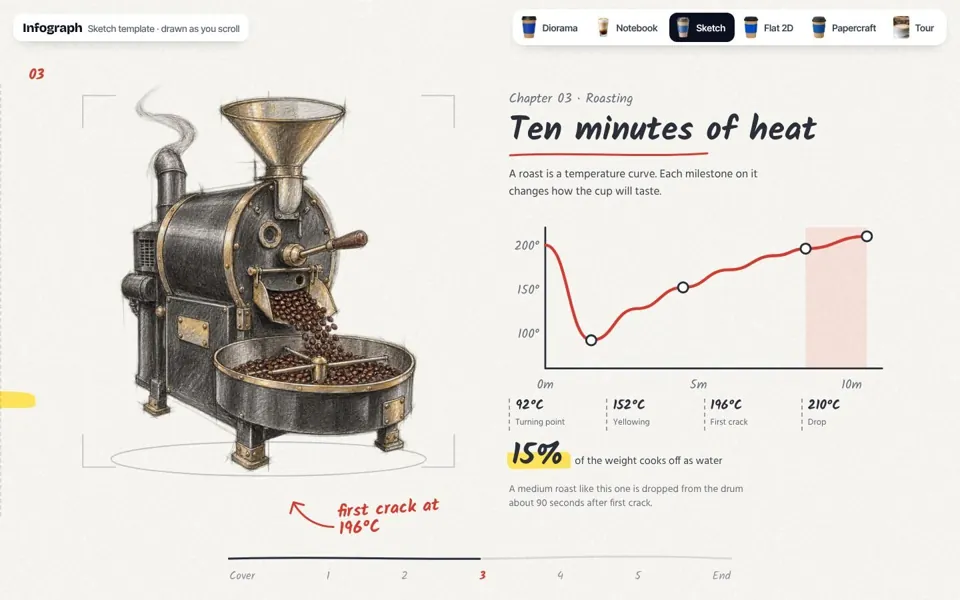
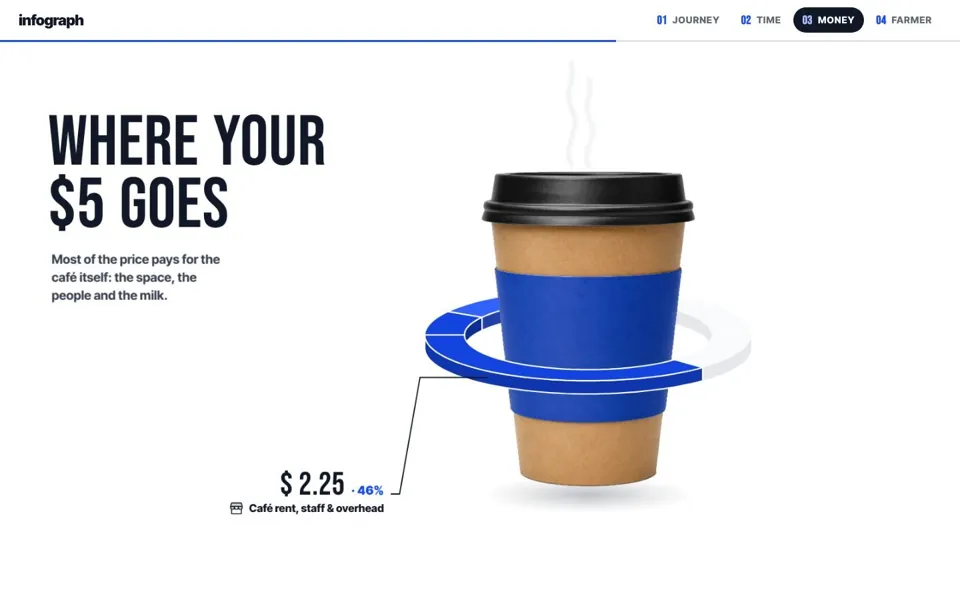
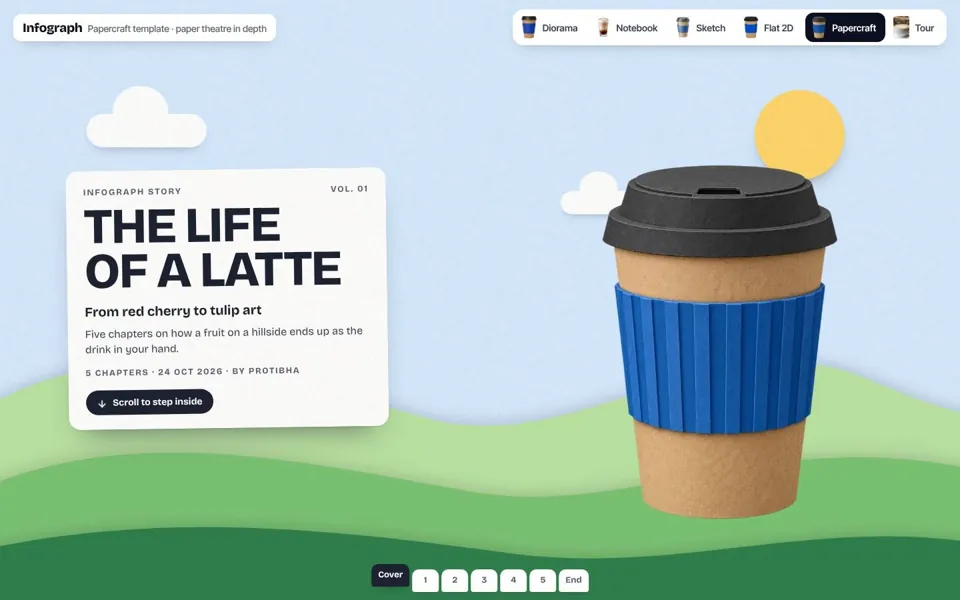
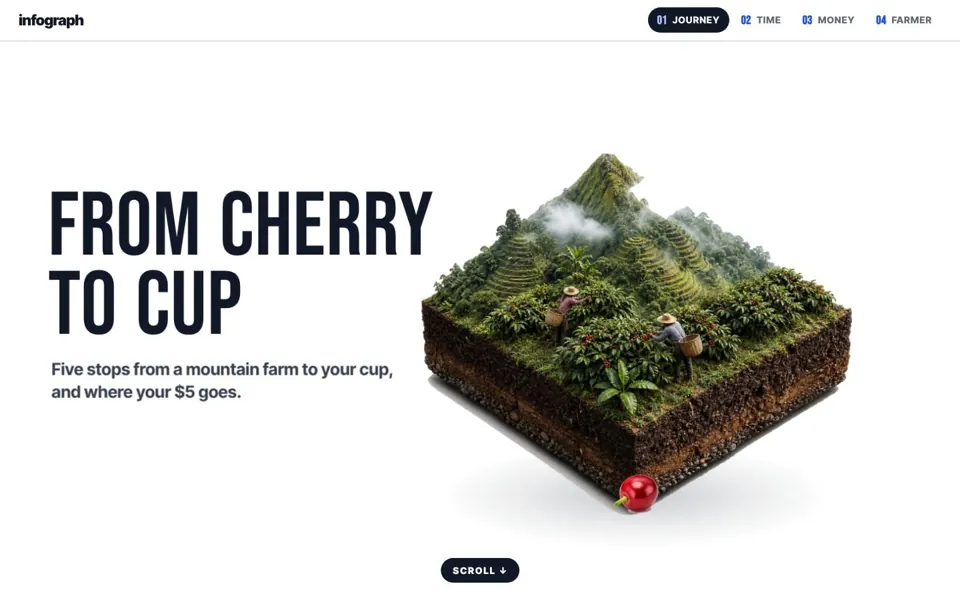
Made from one pasted text about a $5 latte. Keep scrolling: the infograph moves with you, the way it will for your readers.
The result
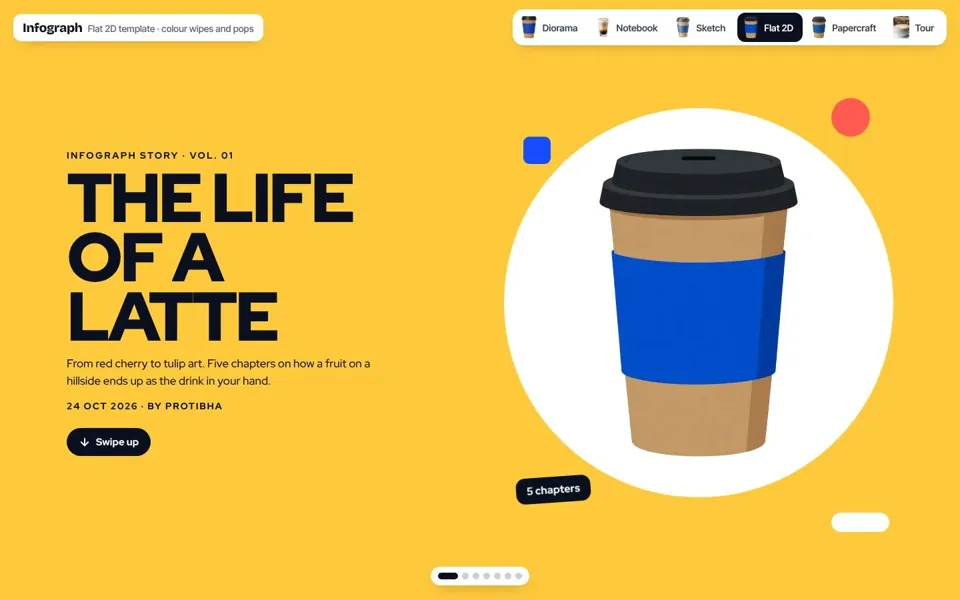
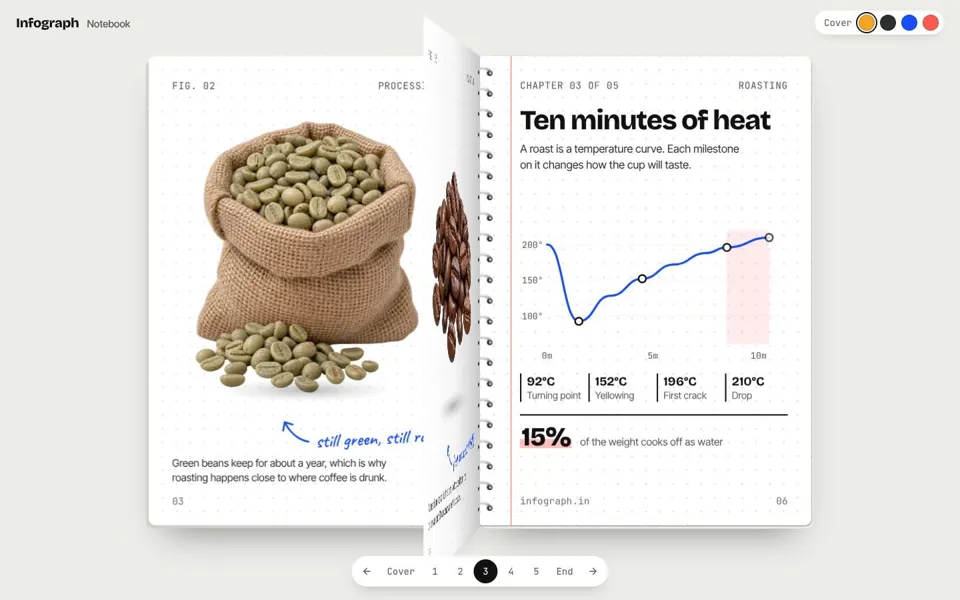
Eight ways to tell the same infograph, each one made to be read to the end. One pasted text about a latte, told by all eight: seven with a picture on every card, and Graphical, the Instant one, drawn in diagrams. Switching takes one click. They play on their own; pick one to watch it.
Instant infographs
The call starts in five minutes and all you have is a page of notes. Pick Instant and Infograph draws them as clear charts, timelines and diagrams in the Graphical template, with no AI pictures to wait for. Every number still comes from your source.

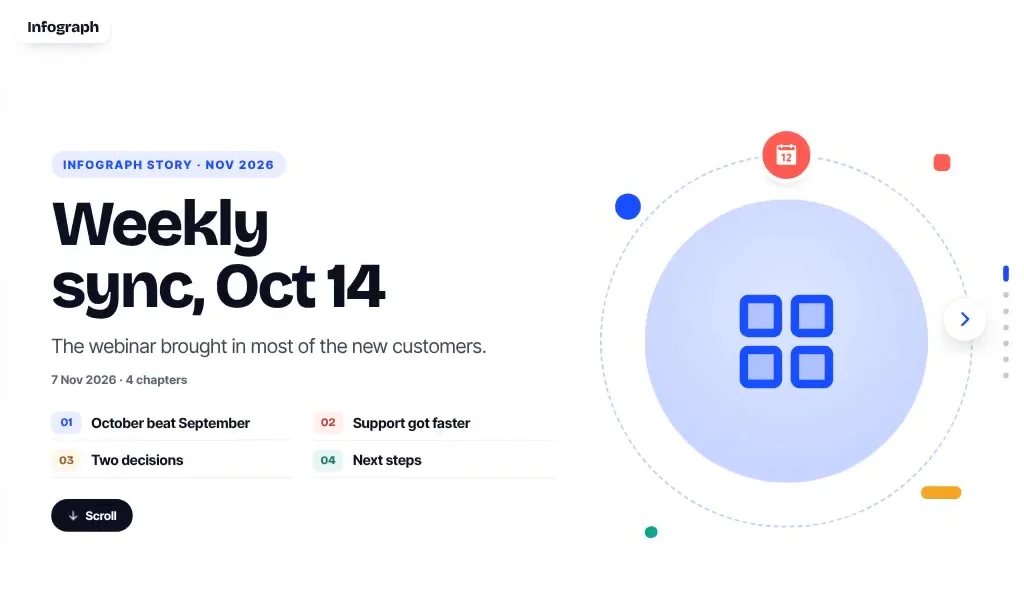
Meeting Notes
Stay in the conversation instead of typing through it. You get an infograph your team will actually read. Open your Google Meet, Zoom or Teams call in Chrome or Edge, go to Meeting Notes in the app and press Start: the words appear a few seconds after they are said. Press Stop, pick a size, and the whole meeting becomes a scrolling infograph, kept in My content and your Brain.
The most powerful part
You read something brilliant last week. Now it’s lost somewhere in a hundred tabs and old chats. With Infograph, every AI chat, web page and note you save lands in your Brain, next to every infograph you make. Ask it like a chat, and it answers only from your own notes, then shows you the exact infograph or note it used.

The promise
Plenty of AI tools fill a gap with a figure that sounds right. Infograph only shows a number it can point to in your text.
Your source
Roasting
25 min
to roast one batch of beans
Not in your text
Roasting
12 to 15 min
to roast one batch of beans
From your source, line 3Roasting takes 12 to 15 minutes at about 200 to 230 °C.
Who it's for
Creators
LinkedIn and Instagram carousels
Students
Snap a photo of any page
Teachers
26 languages, voice-over included
Consultants
A4 or 16:9 slide PDF
Team leads
Meeting Notes on every plan
Marketers
Embed, carousel, images and video
Make it once
Your client in Tokyo and your team in Delhi each read it in their language, in whatever form they open: a link, a carousel, a PDF or a video with a voice-over. 26 languages, made once.
Share link and embedOpens on any phone, or lives in your site
Social carouselsLinkedIn, Instagram, Facebook, X and stories
PDF and imagesA4 to print, 16:9 slides, images in 4:5, 1:1 and 9:16
Video with voice-overMP4 in 9:16, 1:1, 4:5 or 16:9, with music, sound effects and captions
Translate in one clickTurn a finished infograph into another language, or translate just the words you select

The real Flat 2D template, same infograph. Infographs, voice-over and captions in any of 26 languages, and a finished infograph translates in one click.
The offer
Paste anything, get a scrolling visual story with a picture on every card, in under a minute. Instant infographs, drawn in diagrams, are ready in about 15 seconds.
Instead of an evening in a design toolAsk anything you have saved, like a chat. It answers from your own notes and infographs, and shows you the exact one it used.
Instead of digging through old tabs and chatsSeven with a picture on every card, plus Graphical for Instant infographs. Every template, look and scroll effect, on every plan.
Instead of hiring a designerEvery figure has to appear in your source, and the source stays attached.
Instead of checking by handCarousels, images, A4 and slide PDFs, and MP4 video with voice-over, music and captions.
Instead of four separate toolsMake it in one language, translate it into another in one click.
Instead of a translatorTurn any page or AI chat into an infograph.
Instead of copy, paste, reformatYour Google Meet, Zoom or Teams call, written down as it happens, then made into a summary and an infograph. 30 meeting minutes a month on Free, 3 to 10 hours on paid plans.
Instead of a note-taker bot in your callShare a link or embed the infograph on your site. Revoke any link, any time.
Instead of attachments nobody opensFree trial
Every month on the Free plan: 5 Instant infographs and 1 infograph with pictures. No credit card needed to start.
One designed infographic from a freelancer$500 to $1,500
Infograph Plus, a whole month of stories$9.99
Freelancer range: 99designs, as quoted by Venngage in “How much does an infographic cost?”
Founding offer · first 500 buyers
250 credits and 6 hours of meeting notes every month. ₹5,990 in India. Use code FOUNDING500 at checkout. When 500 people have claimed it, it's gone.
Paid plans add credits for many more infographs, no Infograph mark, 3 to 10 hours of meeting notes a month and top-ups, from $4.99 a month (₹399 in India). See the plans
Pricing
Yearly plans are billed once a year. Your credits still arrive every month.
$0no credit card needed
Everything you need to try it on what you read today.
No credit card needed to start
$4.99USD / month
For your own notes and posts, every week.
Cancel anytime in two clicks
Most popular
$9.99USD / month · about 33¢ a day
For students, creators and researchers who explain things every week.
Founding 500: Plus yearly for $59 (₹5,990 in India) for the first 500 buyers. Use code FOUNDING500 at checkout. Same 250 credits a month.
Get PlusCancel anytime in two clicks
$19.99USD / month
For people who make visuals every day.
Cancel anytime in two clicks
Top-ups on any paid plan: 100 credits for $3.99 (₹349) or 500 credits for $14.99 (₹1,249), usable for 12 months.
Students, teachers and nonprofits get 40% off yearly plans: email support@infograph.in.
5 Instant infographs and 1 infograph with pictures every month on the Free plan. No credit card needed to start. Upgrade only when you love it, and cancel in two clicks.
Free includes 5 Instant infographs and 1 infograph with pictures every month, up to 6 cards per infograph. Paid credits renew every month, do not roll over and have no automatic overage charges; top-up credits last 12 months. Prices include taxes, so what you see is what you pay. Billed yearly, Starter, Plus and Pro cost $39, $79 and $179 a year. In India, Starter, Plus and Pro cost ₹399, ₹799 and ₹1,499 a month, or ₹3,990, ₹7,990 and ₹16,490 a year. Read aloud and AI-generated video clips are not included. Payments run through Dodo Payments, our merchant of record. Plan terms · Refunds and cancellation · Contact us about plans.
Before you start
No. Every number in your infograph has to appear in the text you gave it. If a figure is not in your source, Infograph removes it before the infograph reaches you, and the source stays attached so you can check each part before you share it.
No. Infograph picks the shape for each part: a route for a process, two sides for a comparison, bars for a ranking. Pick another look or palette if you want a different feel.
An Instant infograph is ready in about 15 seconds. An infograph with pictures takes under a minute: the infograph is written first, then each card gets its picture.
Yes. Every month the Free plan gives you 5 Instant infographs and 1 infograph with pictures, up to 6 cards each, with every template. No credit card needed to start.
A share link and an embed; carousels for LinkedIn, Instagram, Facebook, X and stories; A4 and 16:9 slide PDFs; images in 4:5, 1:1 and 9:16; and MP4 video with a voice-over, music, sound effects and captions. Infographs, voice-over and captions come in 26 languages, and a finished infograph translates into any of them in one click, whole or just the words you select.
Yes. Change the wording, reorder the blocks or pick a new look before you share. Nothing is public until you share it.
Open your Google Meet, Zoom or Teams call in a Chrome or Edge tab on a computer. In the app, go to Meeting Notes, press Start, pick the meeting tab and tick Also share tab audio. A Copy notice button gives you a line to paste in the meeting chat so everyone knows notes are being taken. The words appear a few seconds after they are said. Press Stop, pick a size and press Make: the meeting becomes an infograph, and the transcript is kept in My content and your Brain. No bot joins the call. The audio goes in short pieces to a speech-to-text provider, is never stored, and only the text is kept. Free includes 30 minutes a month; Starter, Plus and Pro include 3, 6 and 10 hours.
Your memory inside Infograph. Every AI chat, web page and note you capture, and every infograph you make, is kept in your Brain. Ask it anything, the way you would in a chat: it picks the notes and infographs that match, answers only from them, cites each one and shows a card that opens it, so you can check the source or get the exact infograph back. To write the answer, the notes it uses go to the same AI provider that writes your infographs.
Yes. Your infographs stay private until you share one, and you can revoke any link so new readers cannot open it. The text you paste goes only to the AI providers that build your infograph; we do not sell it or use it for advertising. The privacy policy lists the providers and how long data is kept.
Nothing is charged. Your free infographs come back at the start of each month, or you can upgrade from $4.99 a month (₹399 in India). On a paid plan, add a top-up: 100 credits for $3.99 (₹349) or 500 for $14.99 (₹1,249), usable for 12 months. Plan credits renew every month.

Your ideas deserve to be read to the end. You can do one of two things with it.
Takes under a minute. No credit card needed to start.
P.S. Jumped straight to the bottom? That's exactly what your readers do. Give them an infograph instead: paste any text, get a scrolling visual story in under a minute, with every number from your source. Free to start.
P.P.S. The founding price, a full year of Plus for $59, is for the first 500 buyers only. Start with the free trial today; no credit card needed.


